Given an array of data, what is the slowest way to sum up the integers? Is it adding the numbers from left to right, adding them randomly, or doing something else? In this post, we are going to build a data access pattern from the ground up that sums numbers as slowly as possible by exploiting memory pitfalls.
// sequential
data[0] + data[1] + data[2] + ...
// random
data[67] + data[69420] + data[42] + ...
// the slowest
data[???] + ...
Spoiler: We are going to do >30% worse than a randomized access pattern.
Some rules:
- Only consider the time taken to run the accumulation function. The time taken to create
positionsisn’t included. - The accumulation function is fixed as follows, and
datais filled randomly and we are only allowed to change the contents ofpositions:
constexpr int ELEMENT_COUNT = (1 << 16) * (PAGE_SIZE / sizeof(uint32_t));  // 2^26

/* data contains integers that we want to sum up
 * positions is the access pattern that we use to sum up the integers
 * Overflow is expected, but we don’t really care about the actual sum, do we?
 */
uint32_t accumulator(uint32_t const* data, uint32_t const* positions) {
    uint32_t total = 0;
    for (uint32_t i = 0; i < ELEMENT_COUNT; ++i) {
        uint32_t pos = positions[i];
        total += data[pos];
    }
    return total;
}- Measurements of accumulator durations are based on using
rdtsccycle count.
Some additional notes:
- There are 2^26 integers: using 65536 pages, and each page contains 1024 integers. These numbers are chosen simply so it doesn’t take too long on my machine to run.
- Huge pages are disabled.
- All measurements are based on my machine:
Reveal machine specs Hide code
❯ lscpu
Architecture:                x86_64
CPU op-mode(s):            32-bit, 64-bit
Address sizes:             42 bits physical, 48 bits virtual
Byte Order:                Little Endian
CPU(s):                      8
On-line CPU(s) list:       0-7
Vendor ID:                   GenuineIntel
Model name:                Intel® Core™ Ultra 7 268V
CPU family:              6
Model:                   189
Thread(s) per core:      1
Core(s) per socket:      8
Socket(s):               1
Stepping:                1
CPU(s) scaling MHz:      50%
CPU max MHz:             2200.0000
CPU min MHz:             400.0000
BogoMIPS:                6604.80
Flags:                   …
Virtualization features:
Virtualization:            VT-x
Caches (sum of all):
L1d:                       320 KiB (8 instances)
L1i:                       512 KiB (8 instances)
L2:                        14 MiB (5 instances)
L3:                        12 MiB (1 instance)
NUMA:
…
Vulnerabilities:
…
The full code can be found here, run with g++ -std=c++2a -O3 slowest.cc && taskset -c 3 sudo ./a.out. I highly recommend opening up slowest.cc and running the code.
Our job is to find the permutation of positions that yields the slowest possible timing. Let’s begin with the simplest access pattern:
void linear(uint32_t const* data, uint32_t* positions) {
    for (uint32_t i = 0; i < ELEMENT_COUNT; ++i) {
        positions[i] = i;
    }
}
This is likely the fastest permutation, taking 133M (132752394) cycles. This is expected, since CPUs are heavily optimised for sequential accesses.
On the other hand, we could randomise the permutation of positions.
void fisher_yates_shuffle(uint32_t const* data, uint32_t* positions) {
    linear(data, positions);
    uint32_t remaining = ELEMENT_COUNT;
    for (uint32_t i = 0; i < ELEMENT_COUNT; ++i) {
        uint32_t random = rand() % remaining;
        uint32_t tmp = positions[i];
        positions[i] = positions[i + random];
        positions[i + random] = tmp;
        --remaining;
    }
}
Now, the CPU cannot predict which data it will access next, so randomised access takes 1.57B (1572108618) cycles, which is over 10x worse than with linear access. Could we do worse? Of course. Let’s build up the worst permutation, starting with a simple regression.
Start by setting positions such that every consecutive element accessed is always separated by a cache line, which is the unit of data that is stored in a cache:
void separated_by_a_cacheline(uint32_t const* data, uint32_t* positions) {
    constexpr int element_count_per_cacheline =
        CACHELINE_SIZE / sizeof(uint32_t);
    constexpr int cacheline_count = ELEMENT_COUNT / element_count_per_cacheline;
    static_assert(ELEMENT_COUNT % element_count_per_cacheline == 0);
    int current = 0;
    for (int element_index = 0; element_index < element_count_per_cacheline;
         ++element_index) {
        for (int cacheline_index = 0; cacheline_index < cacheline_count;
             ++cacheline_index) {
            positions[current] =
                cacheline_index * element_count_per_cacheline + element_index;
            ++current;
        }
    }
}
This pattern is terrible because each access uses one 4-byte integer from a 64-byte cache line before moving on. By the time we come back to the same cache line, the useful reuse cache would have been evicted. This culminates in a horrible performance with a cycle count of 719M (718804156), already taking 4x longer than a linear scan.
When accessing elements separated by a cache line, the hardware prefetchers can still recognise a simple streaming pattern in data and start fetching future cache lines before the load requests them. However, many Intel hardware data prefetchers do not prefetch across 4 KiB page boundaries, so this help does not carry smoothly from one page to the next. My guess is that crossing a page boundary requires another virtual-to-physical translation, and adjacent virtual pages are not guaranteed to map to adjacent physical pages, so speculative cross-page prefetches are riskier and less generally useful.
So instead of only separating our access by a cache line, separate it by a full page instead. Each page is 4096 bytes, and the code looks as follows:
void separated_by_a_page(uint32_t const* data, uint32_t* positions) {
    constexpr int element_count_per_page = PAGE_SIZE / sizeof(uint32_t);
    constexpr int page_count = ELEMENT_COUNT / element_count_per_page;
    static_assert(ELEMENT_COUNT % element_count_per_page == 0);
    int current = 0;
    for (int element_index = 0; element_index < element_count_per_page;
         ++element_index) {
        for (int page_index = 0; page_index < page_count; ++page_index) {
            positions[current] =
                page_index * element_count_per_page + element_index;
            ++current;
        }
    }
}
There is a significant regression to 1.41B (1411153154) cycles. While the above talks about hindering the HW prefetcher, there is another memory effect at play. The cache placement policy used by most home machines is set-associativity. This means that a given cache line can only go to a specific set, which contains multiple slots/ways.
❯ lscpu -C
NAME ONE-SIZE ALL-SIZE WAYS TYPE        LEVEL  SETS PHY-LINE COHERENCY-SIZE
L1d       48K     320K   12 Data            1    64        1             64
L1i       64K     512K   16 Instruction     1    64        1             64
L2       2.5M      14M   10 Unified         2  4096        1             64
L3        12M      12M   12 Unified         3 16384        1             64
For my machine, an L1d cache per CPU core has 48KB, 12 slots (ways) in each set and 64 sets within an L1d cache. Because there are 64 sets, data at address A and data at address A + 4096 bytes (64 sets * 64 byte cache line) map to the same L1d set and they have to content for one of the 12 slots available. And because we are striding page by page (4096 bytes), each inner loop keeps hitting the same set instead of spreading across all 64 sets. This matters because that one set only has 12 slots. Once more than 12 active cache lines compete for it, the CPU has to evict and reload lines repeatedly, causing conflict misses. The cache capacity is technically 48 KB, but for this access pattern, the useful L1d capacity is only 768B (12 ways * 64B).
Now, let’s step back and consider the broader shape of the access pattern:
page 0, cacheline 0, elem 0
page 1, cacheline 0, elem 0
page 2, cacheline 0, elem 0
…
page 65534, cacheline 0, elem 0
page 65535, cacheline 0, elem 0
page 0, cacheline 0, elem 1
page 1, cacheline 0, elem 1
page 2, cacheline 0, elem 1
...
After accessing 65536 cache lines, we go back to the same cache line. We say that our cache line reuse distance is 65536 (we access the same cache line after making 65536 accesses). We can do worse by not accessing the same cache line after accessing each page:
void separated_by_a_page_and_cacheline(uint32_t const* data,
                                       uint32_t* positions) {
    constexpr int elements_per_cacheline = CACHELINE_SIZE / sizeof(uint32_t);
    constexpr int elements_per_page = PAGE_SIZE / sizeof(uint32_t);
    constexpr int cacheline_per_page = PAGE_SIZE / CACHELINE_SIZE;
    constexpr int page_count = ELEMENT_COUNT / elements_per_page;

    static_assert(ELEMENT_COUNT % elements_per_page == 0);

    int current = 0;
    for (int element_index_in_cacheline = 0;
         element_index_in_cacheline < elements_per_cacheline;
         ++element_index_in_cacheline) {
        for (int cacheline_index_in_page = 0;
             cacheline_index_in_page < cacheline_per_page;
             ++cacheline_index_in_page) {
            for (int page_index = 0; page_index < page_count; ++page_index) {
                positions[current++] =
                    page_index * elements_per_page +
                    cacheline_index_in_page * elements_per_cacheline +
                    element_index_in_cacheline;
            }
        }
    }
}
We now have a cache reuse distance of 4B (65536 pages * 4096 page size / 64 cacheline size) and the new access pattern:
page 0, cacheline 0, elem 0
page 1, cacheline 0, elem 0
page 2, cacheline 0, elem 0
…
page 65534, cacheline 0, elem 0
page 65535, cacheline 0, elem 0
page 0, cacheline 1, elem 0
page 1, cacheline 1, elem 0
page 2, cacheline 1, elem 0
...
However, running separated_by_a_page_and_cacheline, we get the same cycle count of 1.41B (1408519172), which is strange since we expect there to be a regression.
❯ lstopo
Machine (31GB total)
Package L#0
NUMANode L#0 (P#0 31GB)
L3 L#0 (12MB)
L2 L#0 (2560KB) + L1d L#0 (48KB) + L1i L#0 (64KB) + Core L#0 + PU L#0 (P#0)
L2 L#1 (2560KB) + L1d L#1 (48KB) + L1i L#1 (64KB) + Core L#1 + PU L#1 (P#1)
L2 L#2 (2560KB) + L1d L#2 (48KB) + L1i L#2 (64KB) + Core L#2 + PU L#2 (P#2)
L2 L#3 (2560KB) + L1d L#3 (48KB) + L1i L#3 (64KB) + Core L#3 + PU L#3 (P#3)
L2 L#4 (4096KB)
L1d L#4 (32KB) + L1i L#4 (64KB) + Core L#4 + PU L#4 (P#4)
L1d L#5 (32KB) + L1i L#5 (64KB) + Core L#5 + PU L#5 (P#5)
L1d L#6 (32KB) + L1i L#6 (64KB) + Core L#6 + PU L#6 (P#6)
L1d L#7 (32KB) + L1i L#7 (64KB) + Core L#7 + PU L#7 (P#7)
HostBridge
PCI 00:02.0 (VGA)
PCI 00:0b.0 (ProcessingAccelerator)
PCI 00:14.3 (Network)
Net “wlp0s20f3”
PCIBridge
PCI 04:00.0 (NVMExp)
Block(Disk) “nvme0n1”
Despite a higher cache line-reuse distance of 4M (PAGE_COUNT * PAGE_SIZE / CACHELINE_SIZE), we are using core 3, and the line L2 L#3 (2560KB) + L1d L#3 (48KB) + … indicates that it has 2.5MB of L2 cache and 48KB of L1 cache. After iterating through 65536 pages, we’ve accessed 4MB of data. That is larger than the private L1/L2 capacity of this core, so the cache line we need next is unlikely to still be in the private caches. It may still be in L3, but L3 is slower and subject to its own associativity and replacement behaviour. In our case, we should only expect private-cache reuse if our cache line-reuse distance is less than ~40 thousand ((2560+48)*1024/64).
Our current access pattern accesses consecutive pages. Instead of spacing our access stride one page apart, let’s space it N pages apart.
template <int page_stride>
void separated_by_stride_pages_and_cacheline(uint32_t const* data,
                                             uint32_t* positions) {
    constexpr int elements_per_cacheline = CACHELINE_SIZE / sizeof(uint32_t);
    constexpr int elements_per_page = PAGE_SIZE / sizeof(uint32_t);
    constexpr int cacheline_per_page = PAGE_SIZE / CACHELINE_SIZE;
    constexpr int page_count = ELEMENT_COUNT / elements_per_page;

    static_assert(ELEMENT_COUNT % elements_per_page == 0);
    static_assert(page_stride > 0);

    int current = 0;
    for (int element_index_in_cacheline = 0;
         element_index_in_cacheline < elements_per_cacheline;
         ++element_index_in_cacheline) {
        for (int cacheline_index_in_page = 0;
             cacheline_index_in_page < cacheline_per_page;
             ++cacheline_index_in_page) {
            for (int page_start = 0;
                 page_start < page_stride && page_start < page_count;
                 ++page_start) {
                for (int page_index = page_start; page_index < page_count;
                     page_index += page_stride) {
                    positions[current++] =
                        page_index * elements_per_page +
                        cacheline_index_in_page * elements_per_cacheline +
                        element_index_in_cacheline;
                }
            }
        }
    }
}
The access pattern now:
page 0, cacheline 0, elem 0
page N, cacheline 0, elem 0
page 2N, cacheline 0, elem 0
…
page 0, cacheline 1, elem 0
page N, cacheline 1, elem 0
page 2N, cacheline 1, elem 0
…
page 1, cacheline 0, elem 0
page N + 1, cacheline 0, elem 0
page 2N + 1, cacheline 0, elem 0
…
And instead of just running it for a specific N, plot a graph of cycles against page stride:
An access stride of 8 pages gives the worst result in this sweep, seemingly worse than random accesses. Running with -DSTRIDE=8 in isolation, we get a cycle count of 2.06B (2058425640). There are many other different and interesting memory access effects happening in the graph, but we will not concern ourselves with those today. One likely reason for the peak at stride 8 is address translation: at this stride, we also stop getting data locality in the page-table entries used during page walks:
When accessing data at an address, you are actually trying to access the virtual memory address’s data. The memory management unit (MMU) is in charge of translating the virtual memory address to the physical memory address. Most intro OS classes would have covered this, so we won’t be explaining it here. What we are interested in here is a specific data structure used by the MMU called the page table entry (PTE). This stores the physical page frame number that corresponds to the virtual page, together with flags and other metadata. This PTE is 8 bytes, meaning a cache line fits 8 PTE. With an access stride of 8 pages, I believe that the dominant effect is this: instead of just accessing a new cache line to fetch the data every time we make an access, we now fetch another to handle the page mapping. We have now succeeded in summing up numbers more slowly than with random access.
But we are not done yet. We’ve saturated our cache. We’ve destroyed the HW prefetcher. We’ve stopped reusing the cache line. And we’ve pushed our MMU to the brink by making it “walk” on every access. One last thing we are going to do is to screw with the DRAM controller.
Commodity DRAM is organised into channels, ranks, chips, banks, rows, and columns. The DIMM (think of DIMM as a RAM stick) diagram below is an illustrative example: each DIMM may contain one or more ranks, and each rank contains multiple chips.
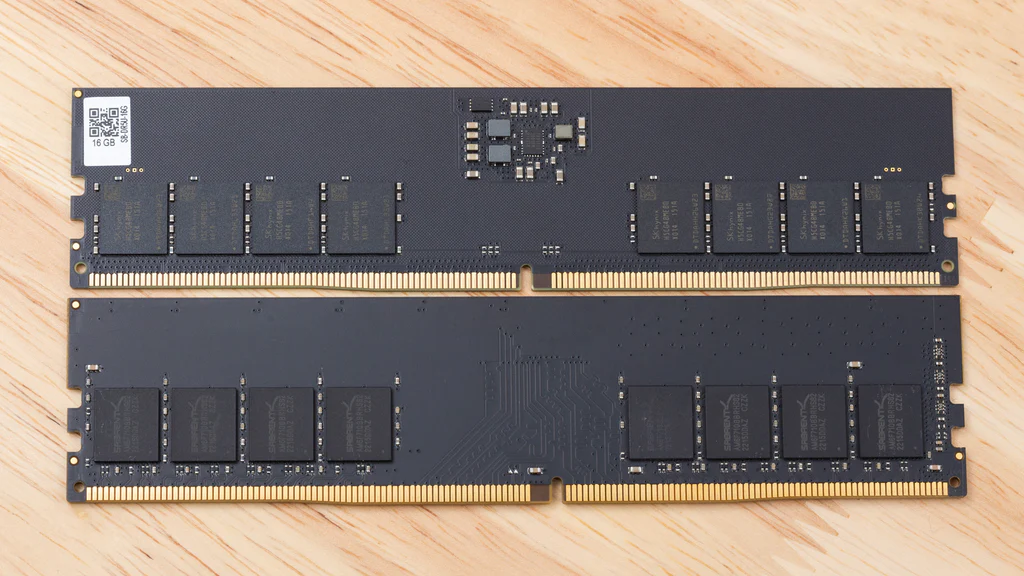
Figure 1: DRAM image, Credits: sabrent
The DIMM shown above contains two ranks, each made up of eight x8 DRAM chips. When the memory controller accesses a rank, all eight chips operate in parallel: each contributes 8 bits of data to the DIMM’s 64-bit data bus. A 64-bit word is therefore distributed across the eight chips rather than stored in any one chip.
For the purpose of this post, we only need to concern ourselves with something called banks. Each chip contains multiple banks, and each bank contains multiple rows, which are a bunch of consecutive bits of data. When accessing data of a specific address on the DRAM, the DRAM memory controller will “activate” the specific row containing the data and copy that row into the row buffer area. From that buffer, it then extracts the 8 bits of data from the column that we are interested in.
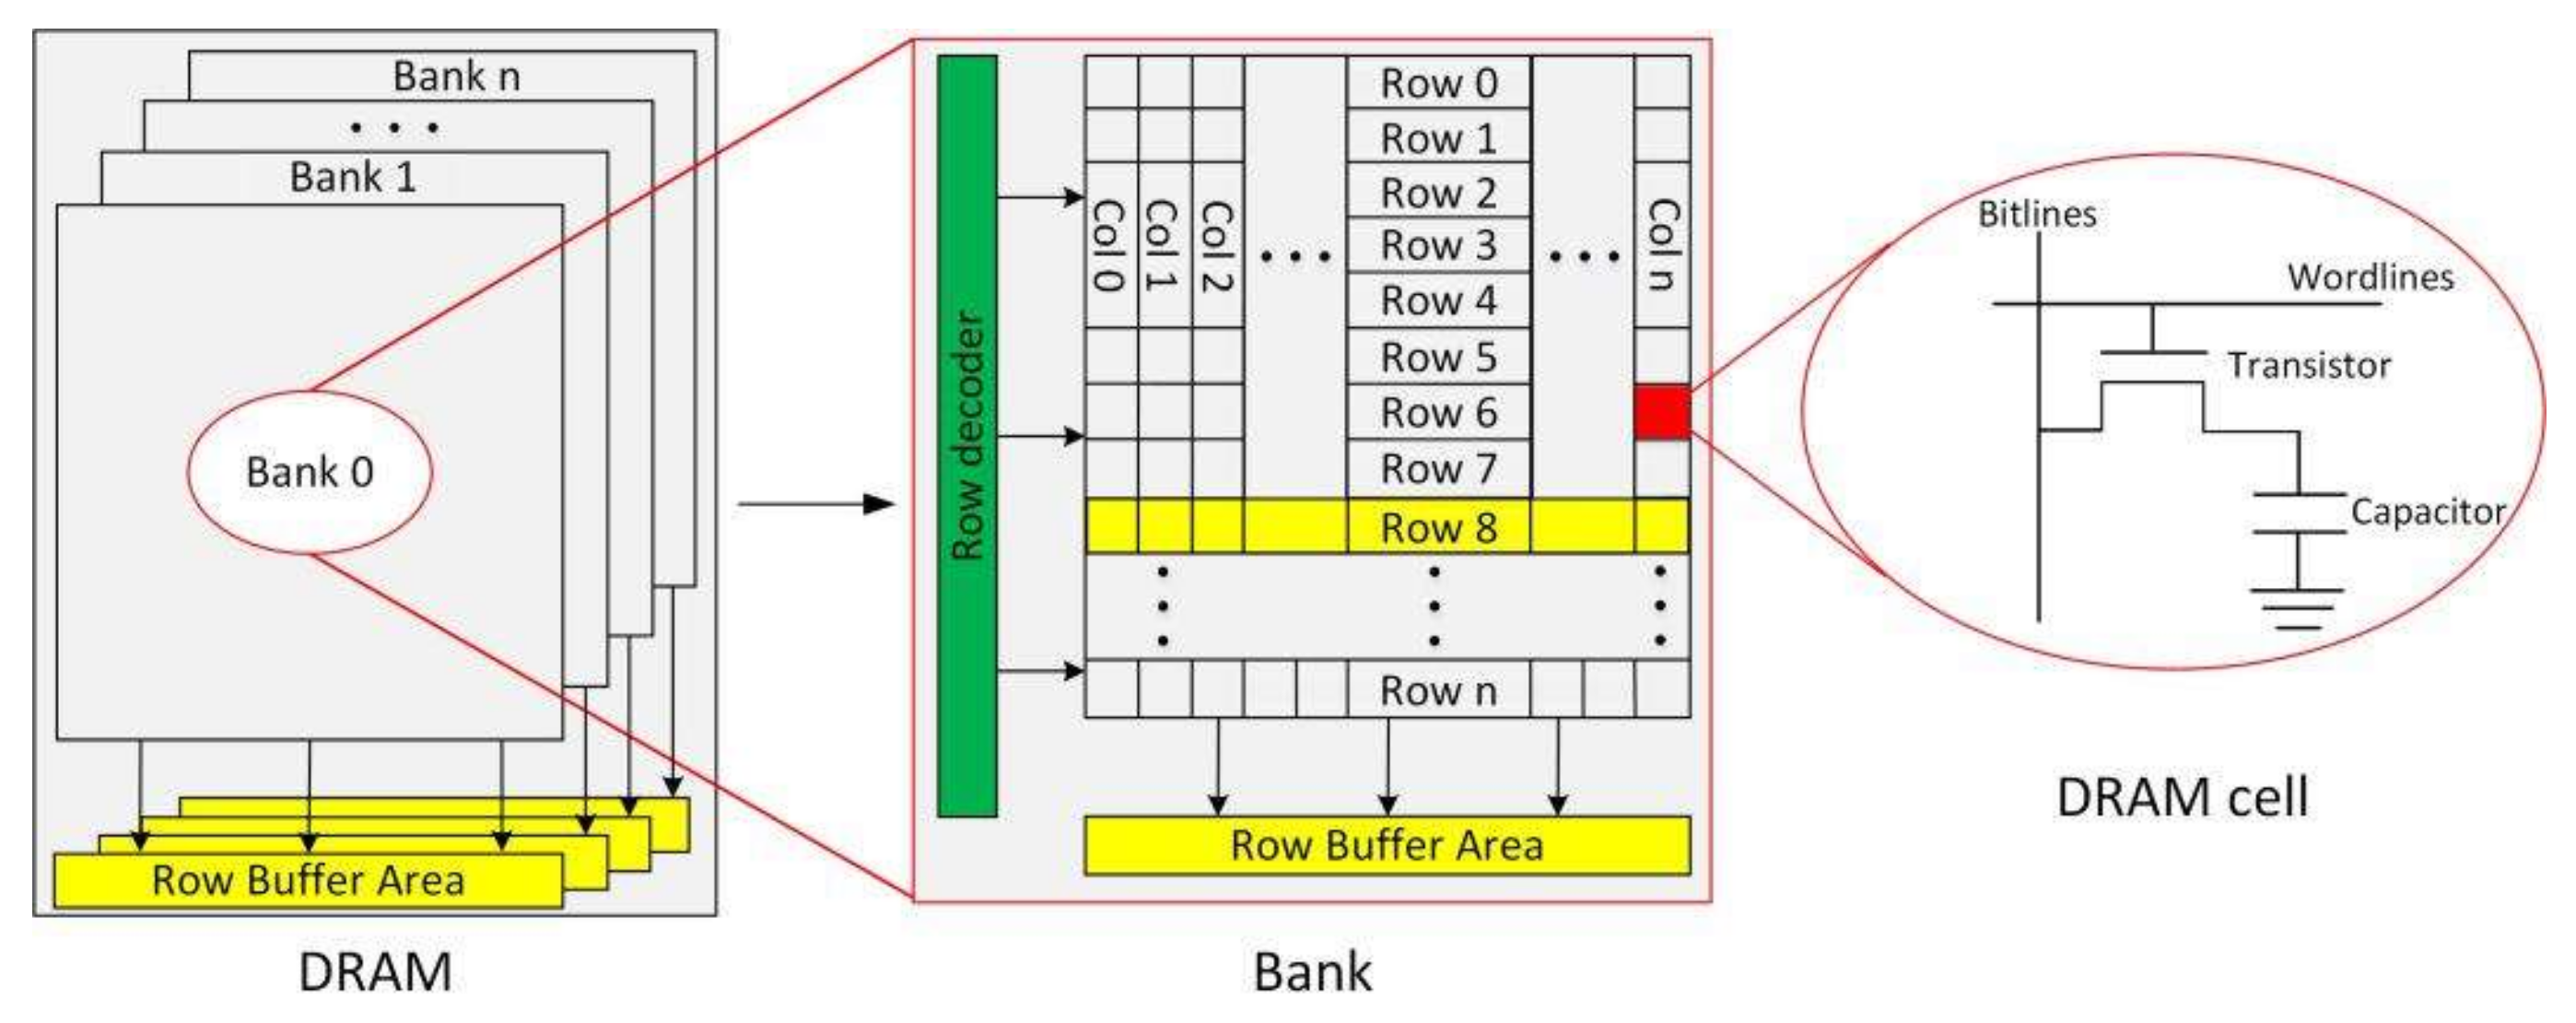
Figure 2: Accessing data in a DRAM, credits: https://www.mdpi.com/2079-9292/10/4/438
Before a bank can access data from a different row, it must deactivate the currently open row with a precharge operation and then activate the new one. Repeatedly alternating between rows in the same bank therefore causes row-buffer conflicts, slowing down the DRAM controller’s ability to respond to data requests. On the other hand, if the activated row in the bank is already the row that we are interested in, we get a row-buffer hit. Because a rank contains multiple banks, rows from different banks could be activated at the same time, and we don’t want that. Branch Education has a great video about DRAM on YouTube. The figure below shows an approximation of the latency of a row buffer hit versus a row buffer miss.
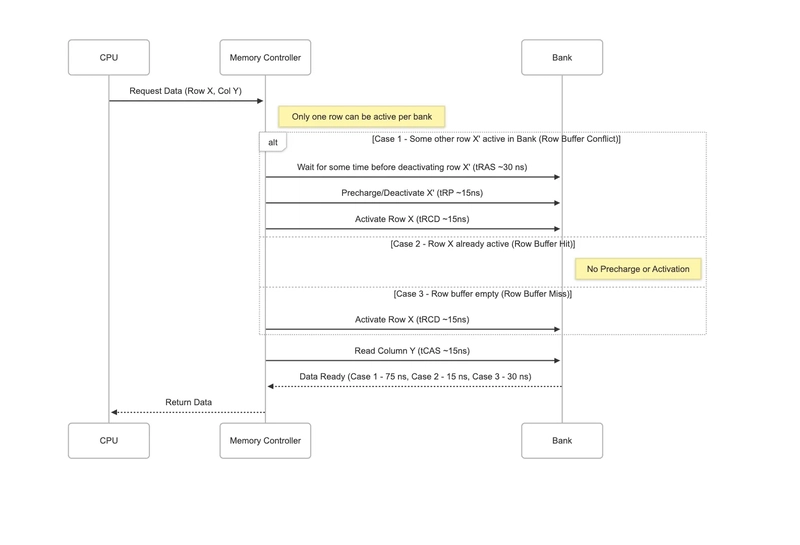
Figure 3: DRAM access time, credits: sachin tolay
In order to get a slower timing, we should add all integers contained in the same bank before moving on to the next bank. Accessing data from multiple banks at the same time gives the DRAM’s memory controller the opportunity to overlap work across the different requests, and we don’t like that. Within each bank, we want every request to be a row-buffer conflict/miss.
The strategy is as follows: Translate the virtual page number to a physical frame number (PFN) using the page table, while preserving the page offset to form the physical address. Next, decode the physical address according to the DRAM address mapping to identify the channel, rank, bank group, bank, row, and column. To create a worst-case access pattern, repeatedly access different rows within the same bank, forcing a precharge and activation on nearly every request while minimising row-buffer locality and bank-level parallelism.
However, the mapping from physical addresses to channels, ranks, banks, and rows is undocumented and platform-dependent. It can vary with the CPU, memory type, BIOS/firmware settings, channel/rank configuration, and address hashing. While we could use tools like DRAMA or Sudoku, I couldn’t get them to work on my machine, so we will just have to approximate it. Using the DRAMA paper and some local experiments, I used the following settings:
constexpr uint32_t DRAM_BANK_GROUP_COUNT = 4;
constexpr uint32_t DRAM_BANK_COUNT_PER_GROUP = 4;
constexpr uint32_t DRAM_ROW_SHIFT = 18;  // empirically tested between 15 to 19
DramLocation physical_address_to_dram_location(uint64_t physical_address,
                                               uint32_t page_index) {
    auto get_bit = [&](uint32_t index) {
        return (physical_address >> index) & 1;
    };

    uint64_t bg0 = get_bit(7) ^ get_bit(14);
    uint64_t bg1 = get_bit(15) ^ get_bit(19);
    uint64_t bg = bg1 * 2 + bg0;
    uint64_t ba0 = get_bit(17) ^ get_bit(21);
    uint64_t ba1 = get_bit(18) ^ get_bit(22);
    uint64_t ba = ba1 * 2 + ba0;

    return {
        .bank_index = bg * DRAM_BANK_COUNT_PER_GROUP + ba,
        .rank = 0,     // assume rank is 0
        .channel = 0,  // assume we only have 1 channel
        .row_index = physical_address >> DRAM_ROW_SHIFT,
        .page_index = page_index,
    };
}
With all of that in place, we see that the cycle count is consistently but not significantly higher at 2.08B (2082308014). Other than the wrong use of bank group hash, bank hash, and the estimated row shift, we are also striding data by an 8-page stride, meaning we access data approximately 32KB apart, and they are not going to be in the same DRAM row anyway. Hence, this access pattern doesn’t cause as much row conflict as we would like. The only thing we can exploit here is using only one bank at a time, but again, because of how Intel hashes the banks, we are still using multiple banks at once, and we aren’t able to fully exploit this memory loophole. But I thought the idea of exploiting DRAM accesses patterns is interesting and hence left it here.
Running all our tests at the same time, an example output of the code is as follows:
~/Developer/rough/slowest main* ⇡
❯ g++ -DSTRIDE=8 -std=c++2a -O3 slowest.cc && taskset -c 3 sudo ./a.out
linear:                                                132752394
fisher_yates_shuffle:                                 1572108618
separated_by_a_cacheline:                              718804156
separated_by_a_page:                                  1411153154
separated_by_a_page_and_cacheline:                    1408519172
stride=8 separated_by_stride_pages_and_cacheline:     2058425640
separated_by_stride_bank_conflicts_and_cacheline:     2082308014
Random access is probably the first answer that comes to mind when thinking of the slowest access pattern, but by understanding what makes randomising access slow, we managed to get an even slower access pattern. We access data separated by cache lines, pages, and leaf page-table entries, then try to bias the remaining accesses toward DRAM bank/row conflicts. This makes the hardware caching and prefetching mechanisms much less useful, causing a 33% slowdown, which I think is pretty cool.
Closing notes:
- Despite us comedically trying to make our code slower, I hope that readers learned something about how memory works!
- If you liked reading this post, you might be interested in a problem on highload.fun, which, while working on that problem, inspired this post.
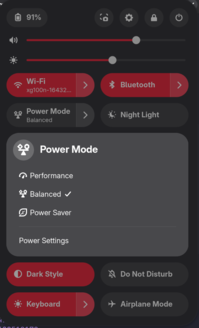
- One cheat way of slowing down the accumulation further is by toggling the power mode. I only noticed this when my laptop was low on power and went to power saving mode.
- Some of you buggers out there are sure to find a slower access pattern, and if so, let me know!